SMS 2020 Winter Image Competition
2020 Winter Image Competition
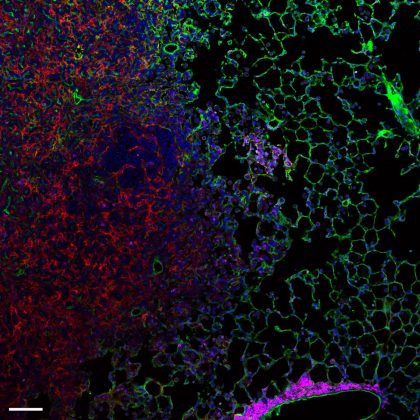
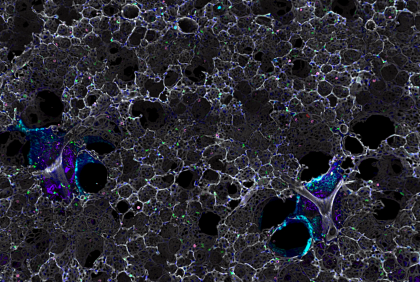
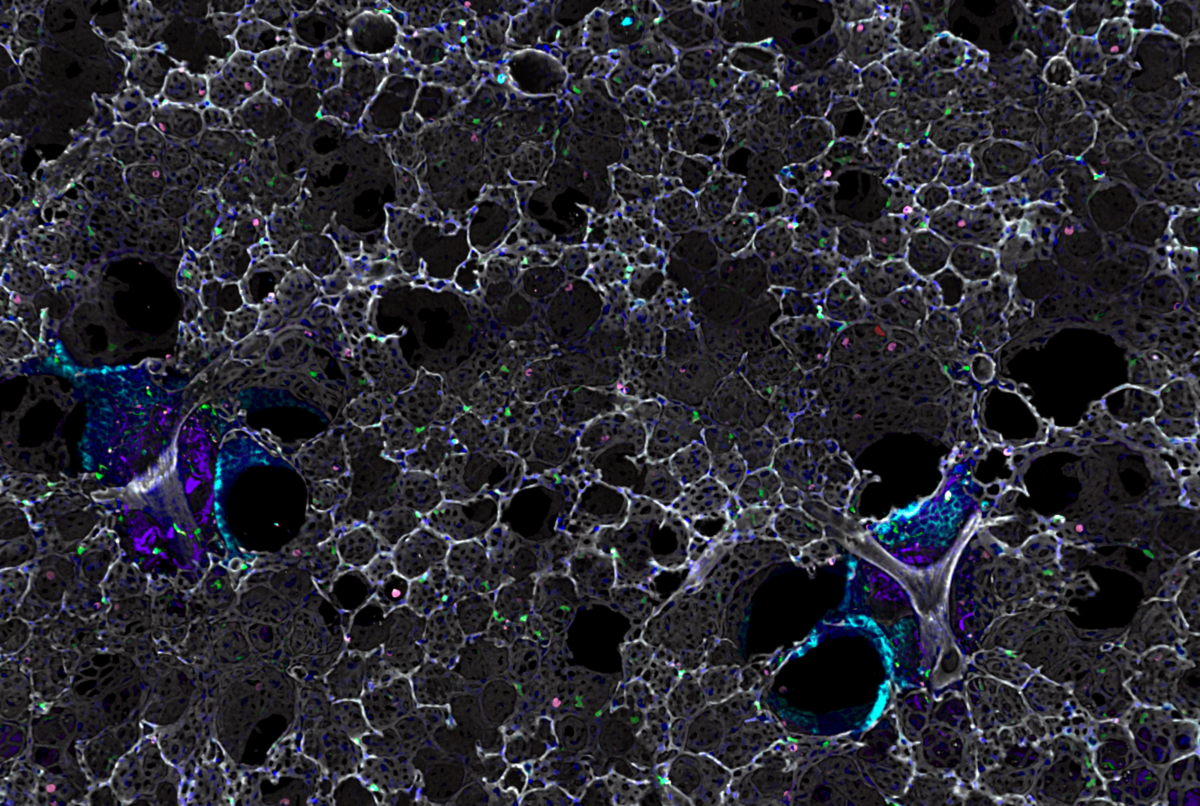
Well done to Marco De Donatis, a PhD student at the Beatson Institute for Cancer Research, for his winning entry of ‘Metastatic Lung’. Marco won the £100 prize
Winner: Metastatic Lung Slice
The image was acquired using a confocal Zeiss LSM 880 microscope with a Plan-Apochromat 40x/1.3 NA oil immersion objective (Carl Zeiss) and 405 nm (1.2 %), 488 nm (35.0 %), 561 nm (10.0 %) and 633 nm (70.0 %) lasers as excitation source. Signals were recorded in lambda mode using the 32 channels Gallium arsenide phosphide (GaAsP) spectral detector with a resolution of 8.9 nm. Master gain was set to 710. The obtained spectral image was processed using the Linear Unmixing tool in Zen Black, thereby extracting the emission of each individual fluorescent dye.
The image is a 10×10 tile scan acquired with 10 % overlap and subsequently stitched in Zen Black. Additional acquisition settings include mean averaging (n=2); 16 bit data depth; 1.5 zoom; 1080×1080 frame size; and z-stacking set to 5 µm and performed using a piezo objective focus drive with 0.5 µm step size. The z-stack was then projected to yield a maximum intensity projection image.
The sample is a metastatic lung slice taken from an endpoint model of pancreatic ductal adenocarcinoma. It was stained with hamster anti-mouse CD31 (clone 2H8), Alexa Fluor 488 rat anti-mouse CD45 (clone 30-F11), Alexa Fluor 647 rat anti-mouse CD54 (clone YN1) and subsequently incubated with the secondary Cy3 goat anti-hamster and DAPI. The aim of the experiment was to (a) visualize the colonization of the lung alveoli by the pancreatic tumour cells; (b) assess the infiltration of CD45-positive immune cells inside the tumour microenvironment; (c) evaluate the expression of the immune adhesion molecule CD54 (ICAM1) on the endothelium at the margin of the metastasis.
Blue is DAPI, magenta is CD45, green is CD31 and red is CD54. Scale bar is 100 µm.
Competition Entries
1. Lonely Tumour Cell
Multiplexed 3d-image of experimental breast cancer metastasis.
The spread of cancer from its primary location to distant sites to recur later (metastasis and recurrence) is the major cause of death among cancer patients. By the time metastasis is detected, clinicians can do very little to treat their patients as they do not often respond well to conventional therapy. The lung is the second most common site of breast cancer metastasis and has the worst outcomes. We now know that even though patients have their tumours surgically removed and receive chemotherapy, tumour cells can still leave the primary tumour early and cause secondary breast cancer to recur later.
We use mouse models of human cancers to understand how tumours manipulate the immune system to thrive and metastasize in the lung. For immunological studies such as this, it is imperative that we use a whole organism with a fully competent immune system, because immune cells regulate each other. To capture difficult-to-image events, we use chemical ‘clearing’ protocols which allow us to make lungs transparent and allow to image very large volume of tissues in three dimensions. We combine it with the staining of different target molecules with fluorescent probes (multiplex) to visualize complex interactions between immune and tumour cells in the lung.
The image presented here shows a three-dimensional view of multiphoton microscopy images. We aimed to visualize lung immune environment one week after the injection of fluorescent tumours cells (red). Can you see the single tumour hidden in blood vasculature (white)? Other colours are for nuclei (blue), bronchial epithelium (cyan), macrophages (pink), fibrillar collagen (purple) and some other Immune cells expressing the CX3CR1 receptor (green).
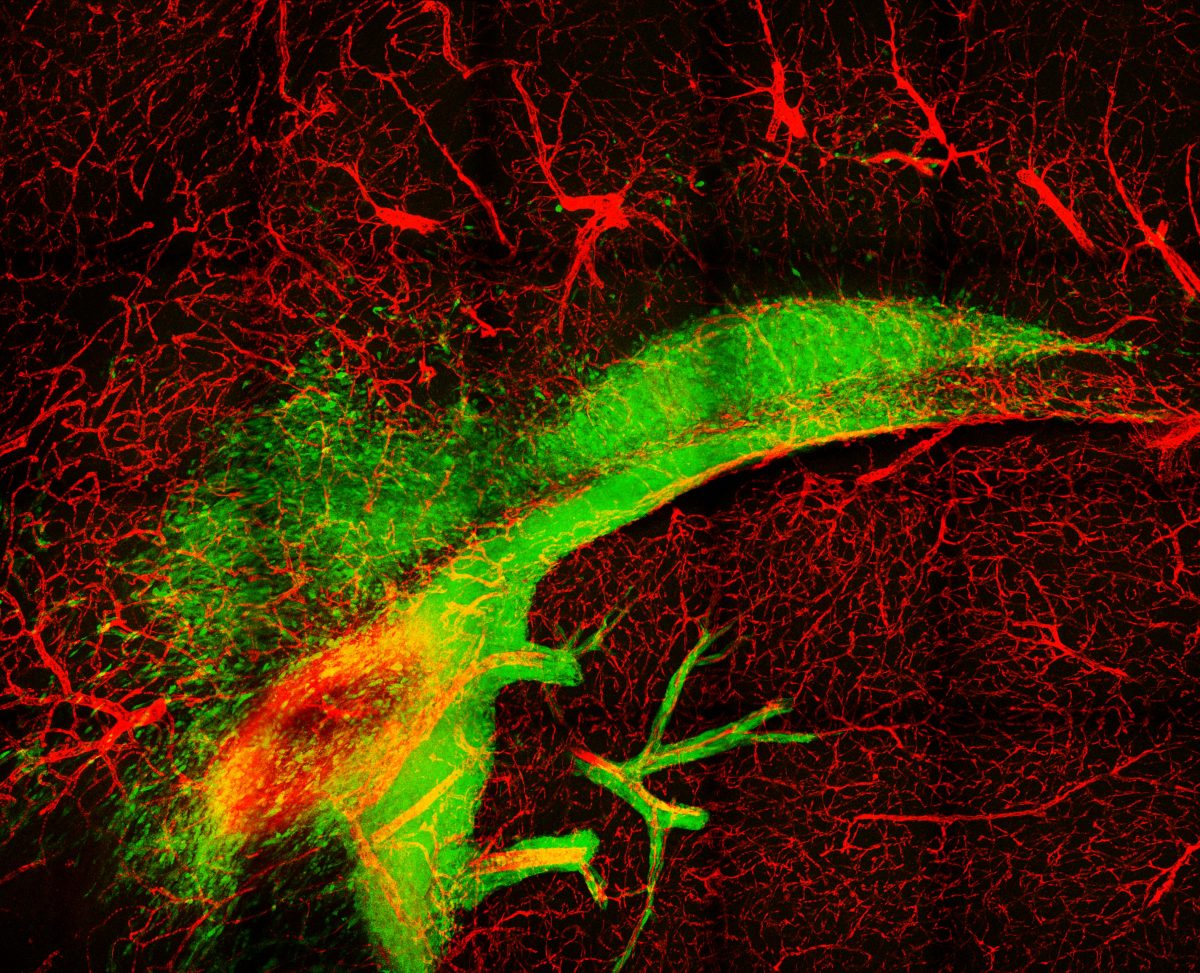
2. Invading Glioblastoma
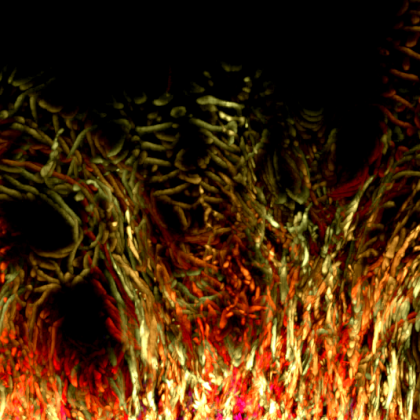
Glioblastoma cells in murine brain observed by multiphoton microscopy
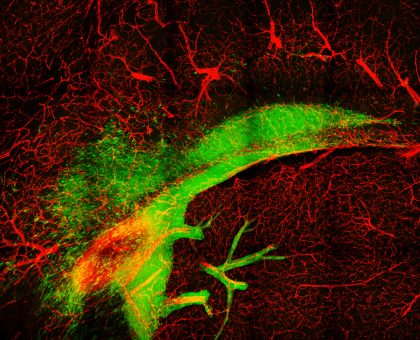
Glioblastoma is the most common and aggressive type of primary brain cancer. One of the major challenges to successful treatment is the ability of glioblastoma cells to infiltrate and spread across the normal brain. This infiltration of tumour cells interferes with normal brain function and is a major contributor to the devastating psychological, cognitive and neurological effects suffered by patients. The diffuse nature of the tumour also prevents complete surgical resection, resulting in disease recurrence and extremely poor patient prognosis, with patients typically surviving just 12- 15 months post diagnosis.
We mouse models of glioblastoma to further understand infiltration and identify new therapeutic targets to contain the spread of glioblastoma tumours during treatment. For this image, a section from a brain containing a glioblastoma tumour (green cells) and labelled blood vessels (red) was treated to a specialised chemical clearing procedure to produce optically clear sample for high resolution volumetric imaging. We were then able to use advanced multi-photon imaging techniques to capture the infiltration of tumour cells away from the tumour bulk along white matter tracts (top ‘arc’ of tumour cells) and blood vessels (red). The result image is a stunning illustration of the highly infiltrative nature of glioblastoma tumours, and the challenges faced by neurosurgeons and clinicians when treating this fatal disease.
4. Fairy Lights
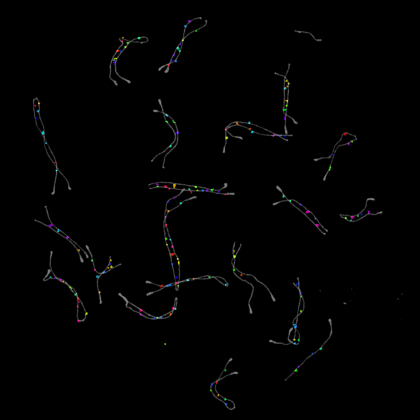
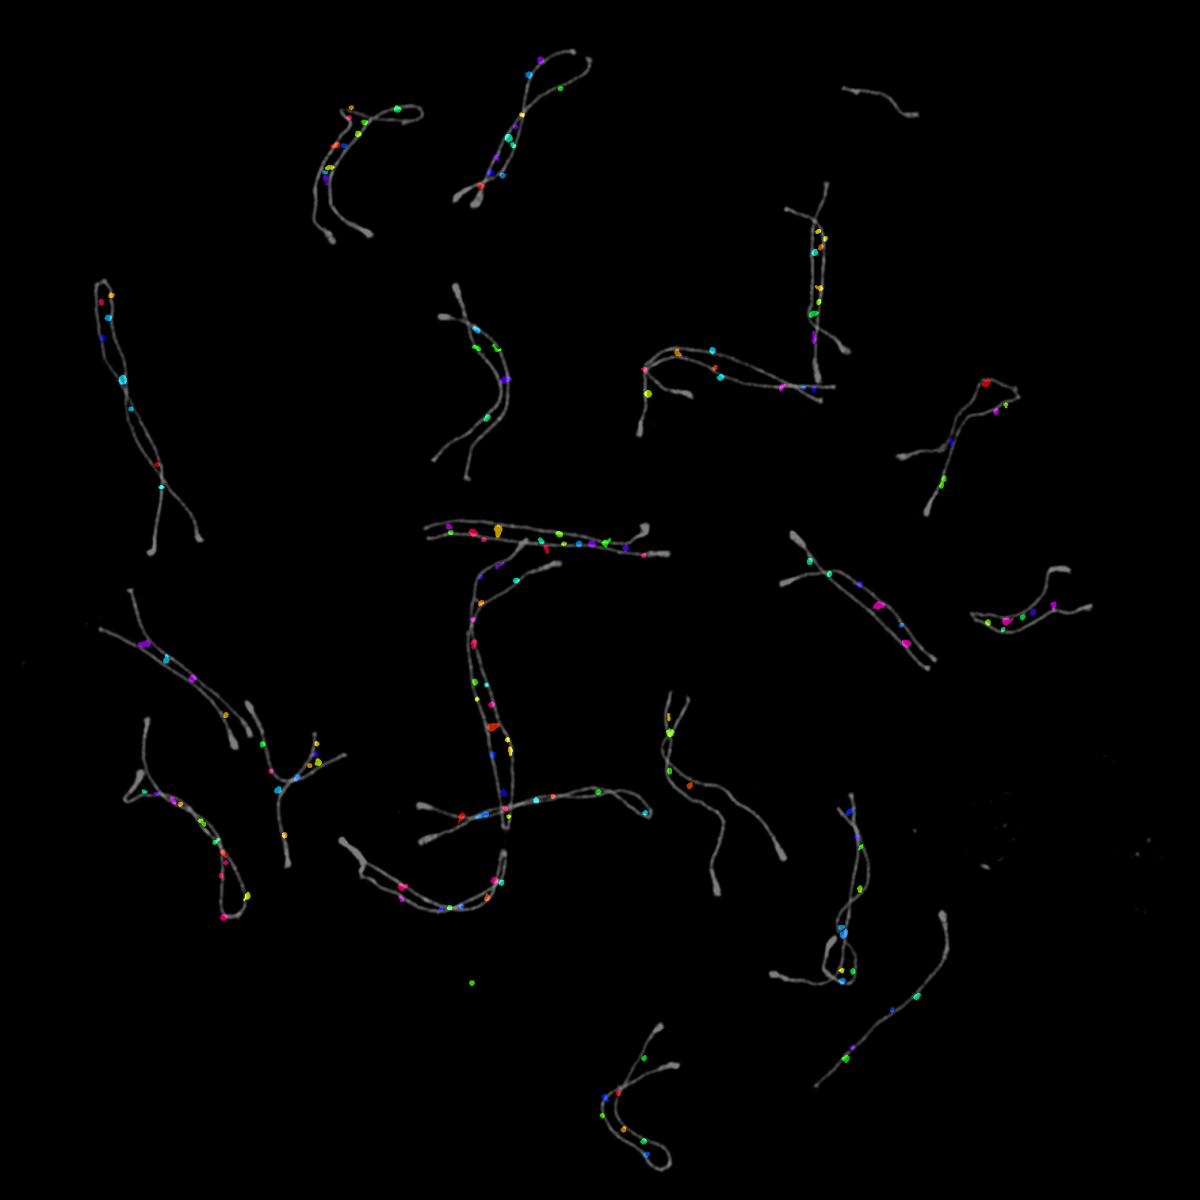
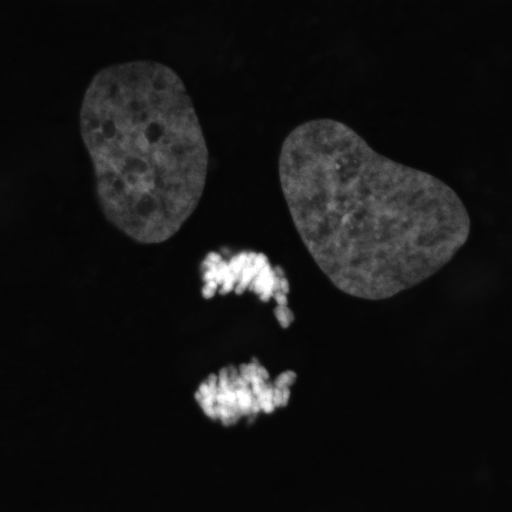
We all inherit two copies of each chromosome from our parents; one from our father and one from our mother. During meiosis each chromosome forms a proteinaceous filament along its axis (SYCP3 – grey) and the two copies of each chromosome are brought together by a search process driven by hundreds of DNA breaks made across the genome. In this image captured using a Nikon N-SIM these DNA breaks have been visualised by staining a repair protein (RAD51), and individual break sites segmented and artificially coloured for downstream quantitative analysis.
5. Filarial Pathology
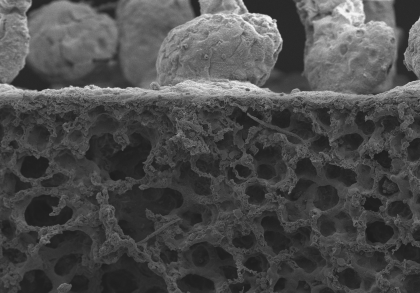
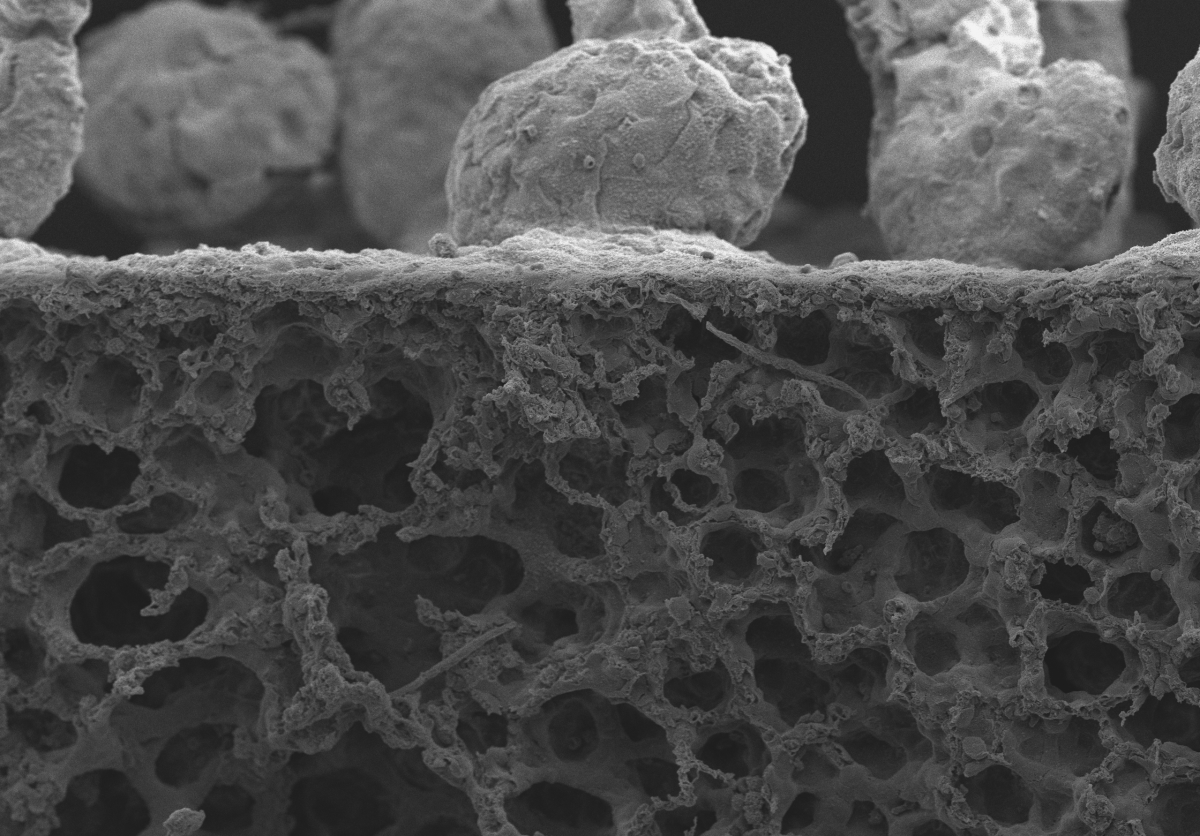
During my time in Coralie Martin’s laboratory (Muséum National d’Histoire Naturelle, Paris), I studied immuno-pathology of filarial infections. Several filarial species are responsible for human tropical diseases such as lymphatic filariasis and onchocerciasis (“river blindness”). I used a rodent model of filariasis (Litomosoides sigmodontis) to explore the immune responses to filarial worms. This parasite lives in the pleural cavity of rodents so I was particularly interested at the pulmonary consequences of the infection. In gerbils, the infection leads to the formation of massive polyps at the surface of the lungs which we can see here by scanning electron microscopy, along with two subpleural microfilariae (the offspring of the parasite).
6. FOXP2
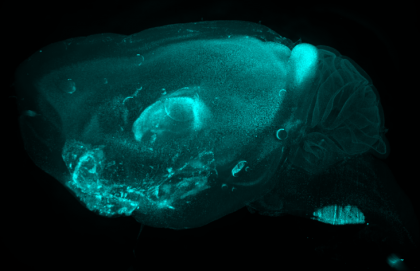
Light-sheet microscopy image of a hemisected mouse brain immunolabeled against FoxP2. Tissue was optically cleared using a tailored iDISCO protocol. We also used a customized whole-brain immuno protocol to label all FoxP2 neurons in the mouse brain. FoxP-positive nuclei are mainly located in deep cortical layers, the superior colliculus, the thalamus and the inferior olive nucleus of the brain, while other brain areas showed different levels of expression. This approach allowed us to visualize and compare immunolabelled neurons across the entire brain, providing a valuable tool to investigate distal brain areas without artefacts arising from cutting and independently labelling and imaging small subsets of brain sections.
Image was acquired with a Ultramicroscope_II using an Olympus MV Plapo 2X objective (CDC immersion cap adjusted to a final 2.152x magnification; WD 6mm). Image was acquired in a single field of view: 17.6 mm diagonal, 3.6 mm in Z, and 1.72x final magnification. Bidirectional illumination using 6 light-sheets (thickness 7um) and dynamic focus was used. Sample was imaged immersed in Ethyl cinnamate (Refractive index 1.56; tissue sample matched). Imaging time: 1 hr.
7. Skate
Little skate embryo (Leucoraja erinacea, stage 29). Stained with DAPI (grey) and cleared in 80% glycerol. 5 weeks post DiI (magenta) injection into the midbrain neural tube. DiI labelled cells present in the tip of the tail – we do not know (yet!) what these cells are or why they have migrated to the very tip of the tail. Multiple z-focus images taken manually on Leica M125 C and rendered using Helicon Focus 7, rendered images then stitched in Adobe Photoshop using automated photomerge function. Total embryo length = 8 cm.
8. Pancreatic Cancer Cell
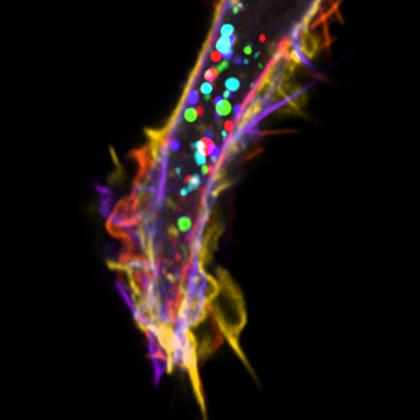
Live-cell imaging of a pancreatic cancer cell labelled with GFP-LifeAct and taking up red fluorescent dextran (70kDa) via macropinocytosis. Cells were imaged every minute for a total of 15 minutes, with Zeiss 880 LSM with Airyscan. Every time-frame was coloured using Fiji software.
10. Metastatic Lung Slice
The image was acquired using a confocal Zeiss LSM 880 microscope with a Plan-Apochromat 40x/1.3 NA oil immersion objective (Carl Zeiss) and 405 nm (1.2 %), 488 nm (35.0 %), 561 nm (10.0 %) and 633 nm (70.0 %) lasers as excitation source. Signals were recorded in lambda mode using the 32 channels Gallium arsenide phosphide (GaAsP) spectral detector with a resolution of 8.9 nm. Master gain was set to 710. The obtained spectral image was processed using the Linear Unmixing tool in Zen Black, thereby extracting the emission of each individual fluorescent dye.
The image is a 10×10 tile scan acquired with 10 % overlap and subsequently stitched in Zen Black. Additional acquisition settings include mean averaging (n=2); 16 bit data depth; 1.5 zoom; 1080×1080 frame size; and z-stacking set to 5 µm and performed using a piezo objective focus drive with 0.5 µm step size. The z-stack was then projected to yield a maximum intensity projection image.
The sample is a metastatic lung slice taken from an endpoint model of pancreatic ductal adenocarcinoma. It was stained with hamster anti-mouse CD31 (clone 2H8), Alexa Fluor 488 rat anti-mouse CD45 (clone 30-F11), Alexa Fluor 647 rat anti-mouse CD54 (clone YN1) and subsequently incubated with the secondary Cy3 goat anti-hamster and DAPI. The aim of the experiment was to (a) visualize the colonization of the lung alveoli by the pancreatic tumour cells; (b) assess the infiltration of CD45-positive immune cells inside the tumour microenvironment; (c) evaluate the expression of the immune adhesion molecule CD54 (ICAM1) on the endothelium at the margin of the metastasis.
Blue is DAPI, magenta is CD45, green is CD31 and red is CD54. Scale bar is 100 µm.
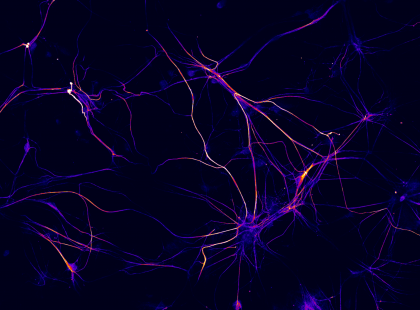
11. Lighting up Memories
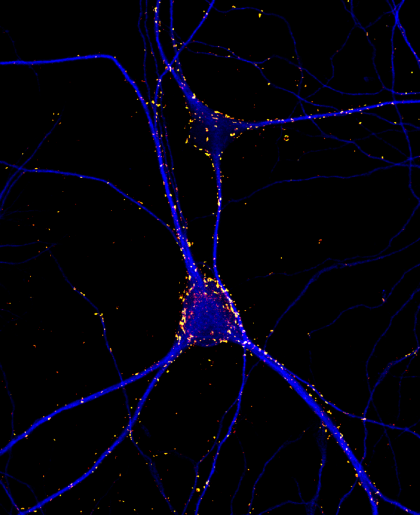
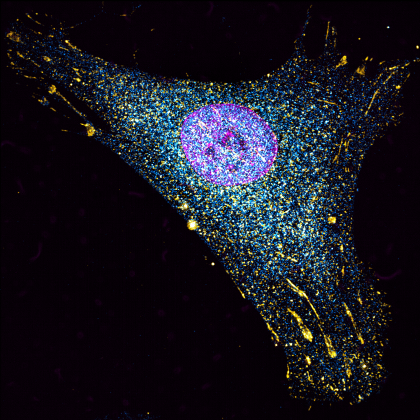
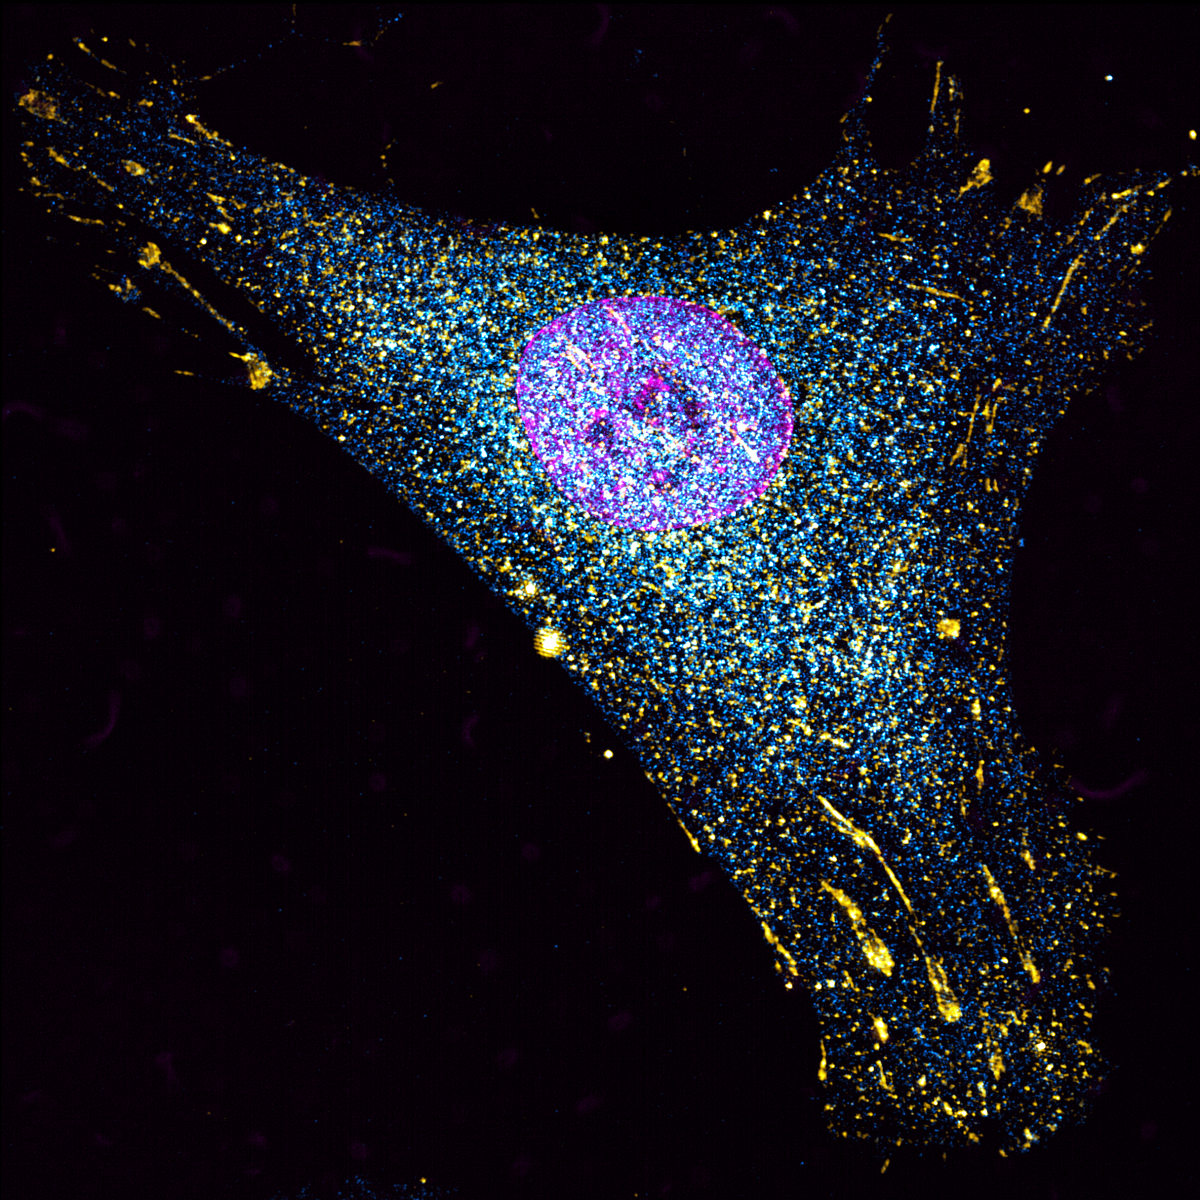
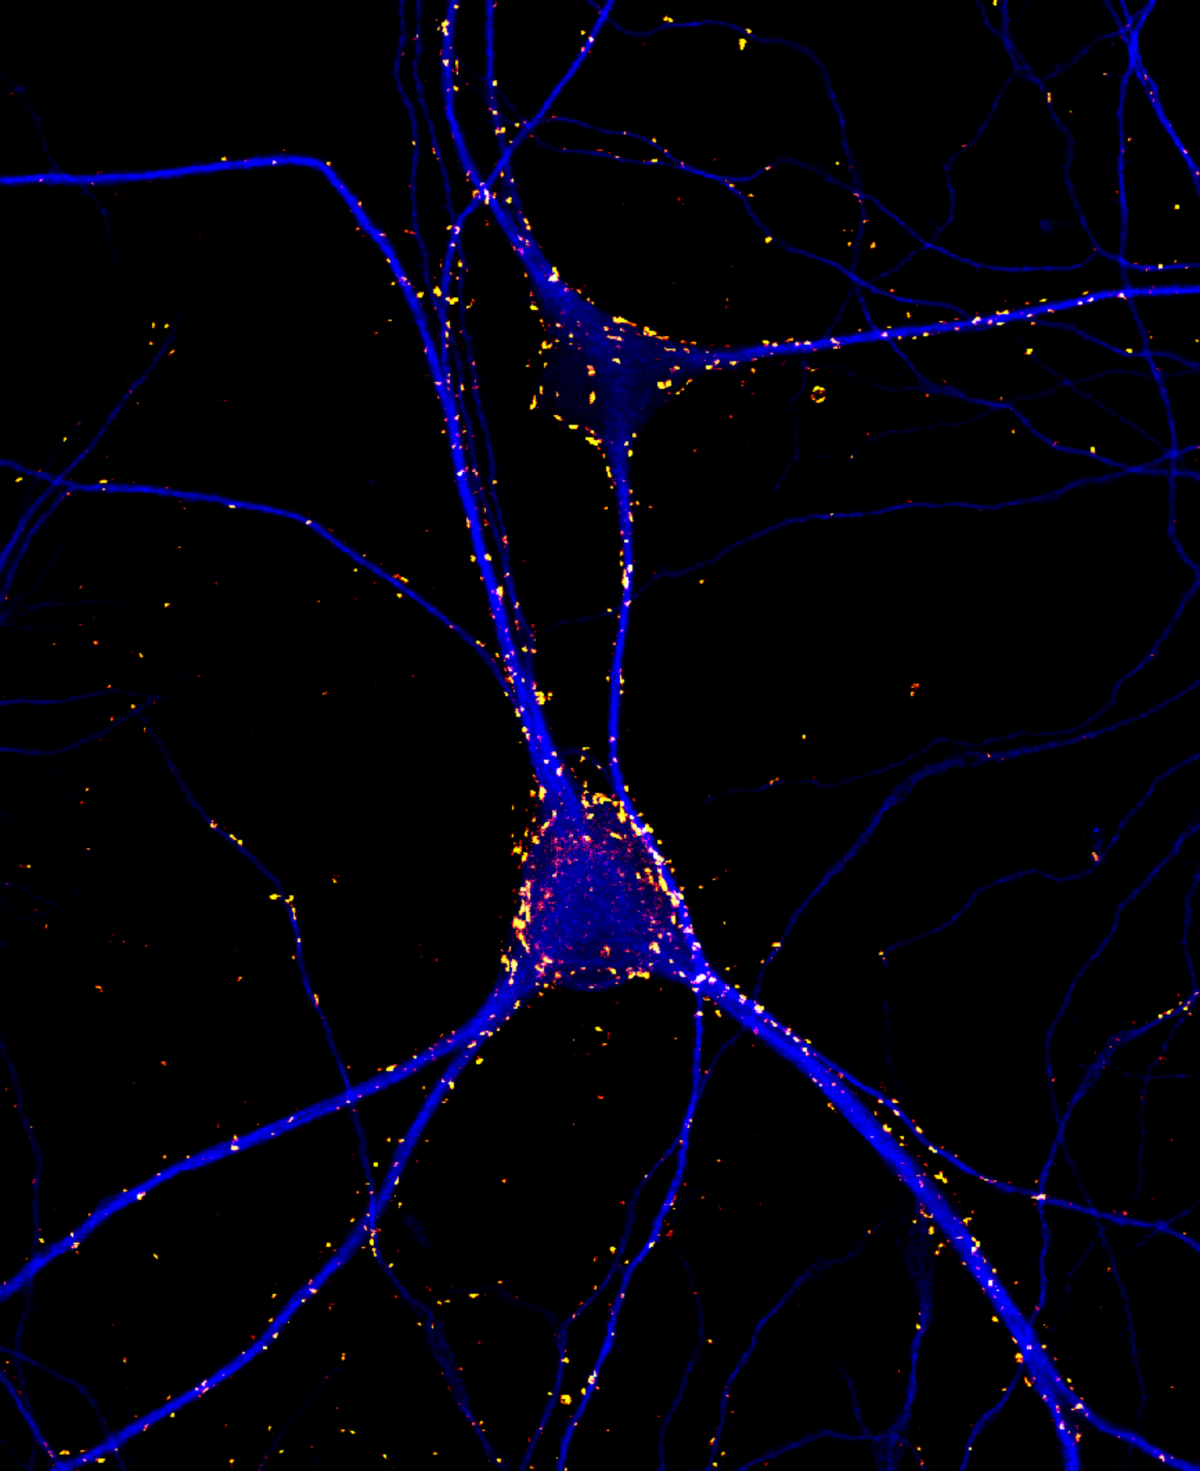
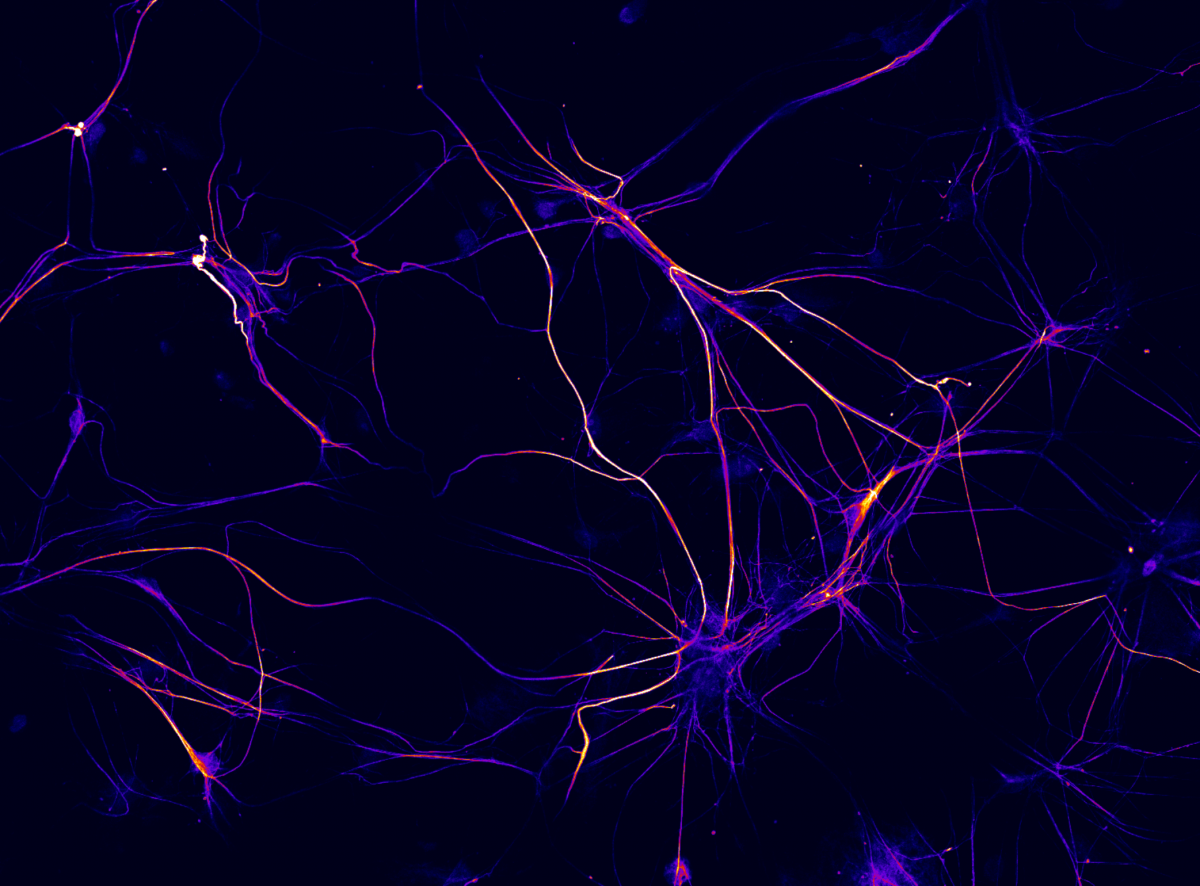
Fluorescence micrograph of 3 week old rat cortical neurons in culture labeled for the presynaptic protein synaptotagmin1 (yellow-red) and dendritic marker MAP2 (blue). Imaged captured using a 60 x oil immersion objective of a confocal microscope (Olympus Fluoview 1000). Synaptoagmin1 regulates calcium dependent neurotransmitter release.
13. Christmas Tree
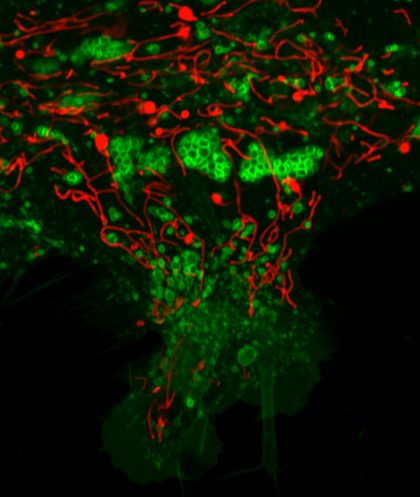
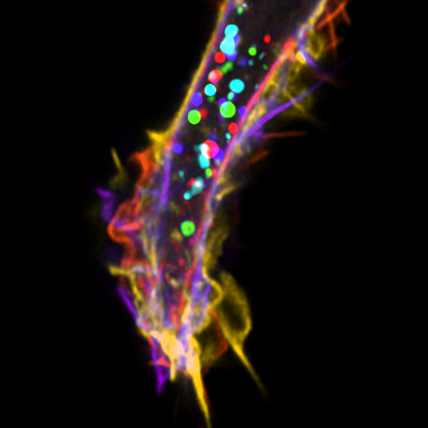
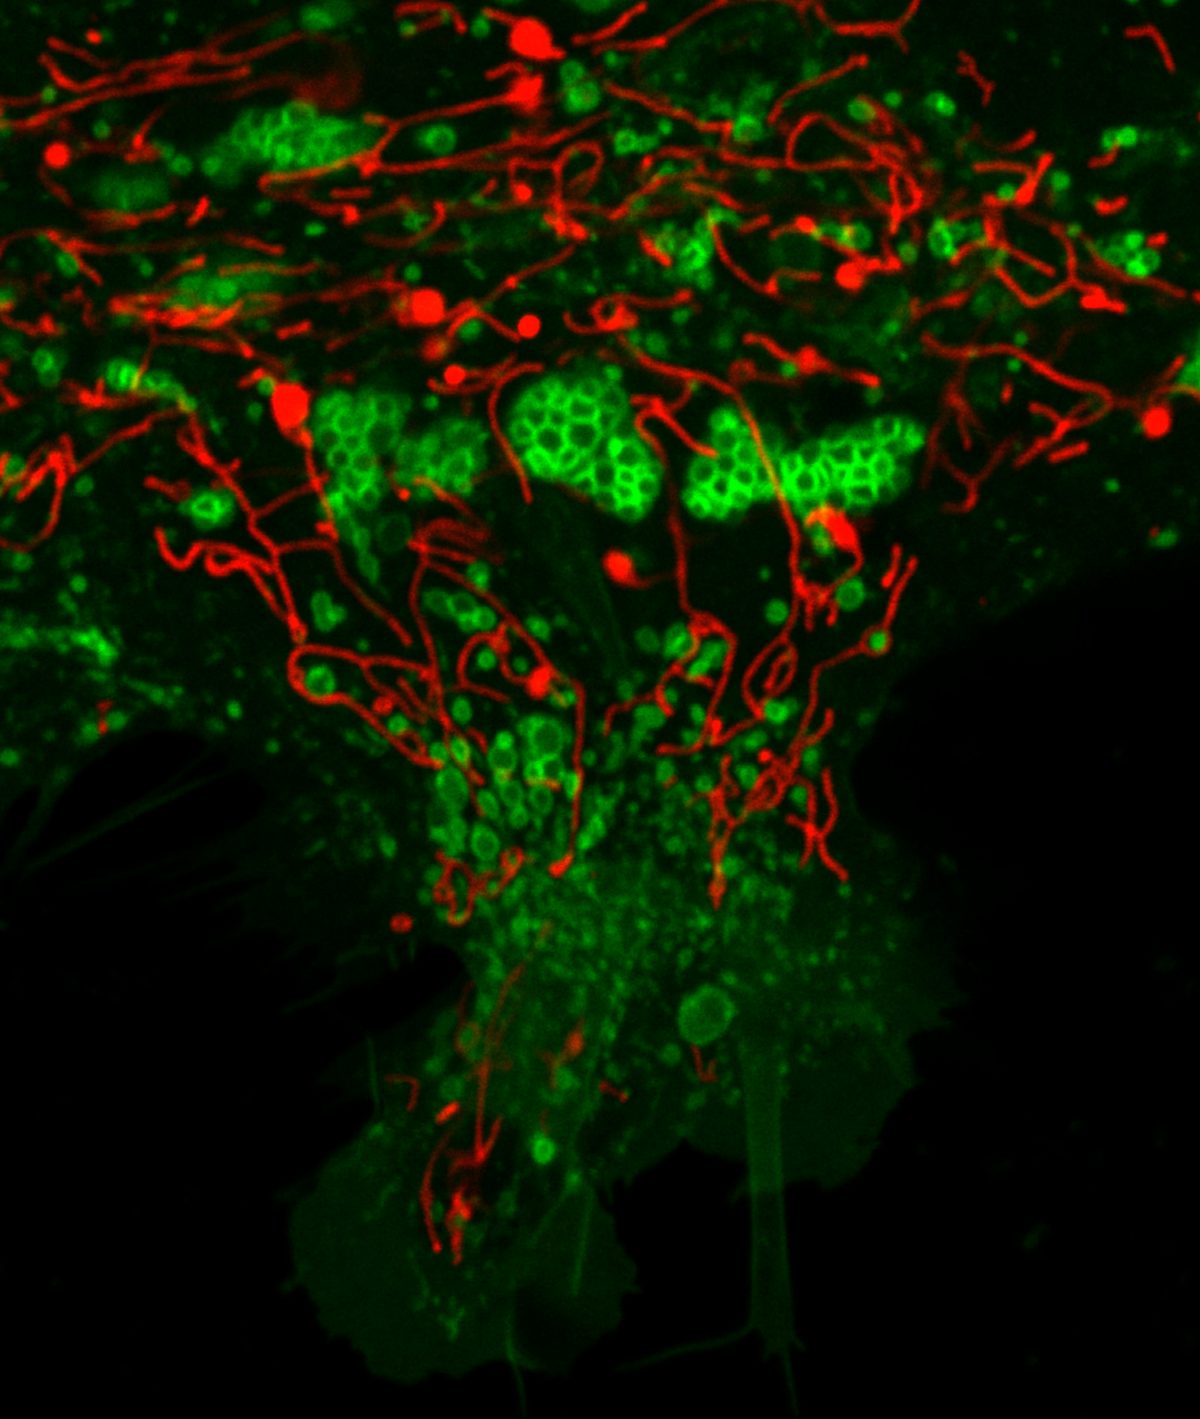
Christmas tree of lysosomes and mitochondria Fluorescence micrograph of human iPSC astrocytes transduced with mitochondria tagged red fluorescent protein (red) and lysosome tagged green fluorescent protein (green). Image captured using 60x oil immersion objective of Nikon A1R confocal microscope.
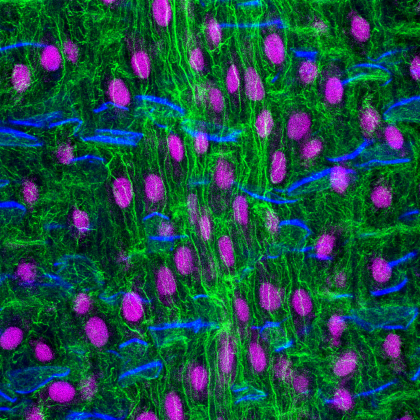
17. Corn Root
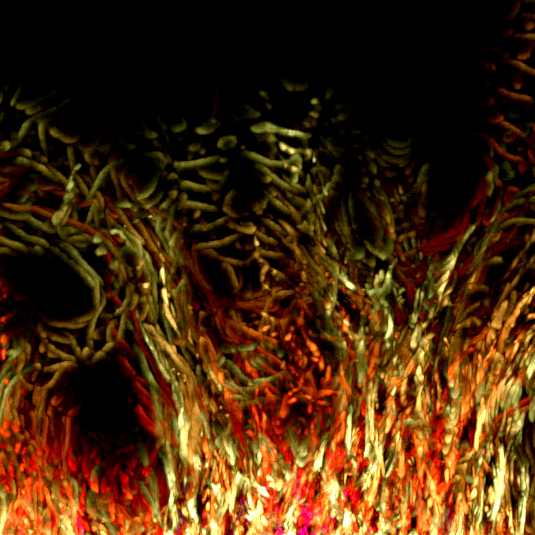
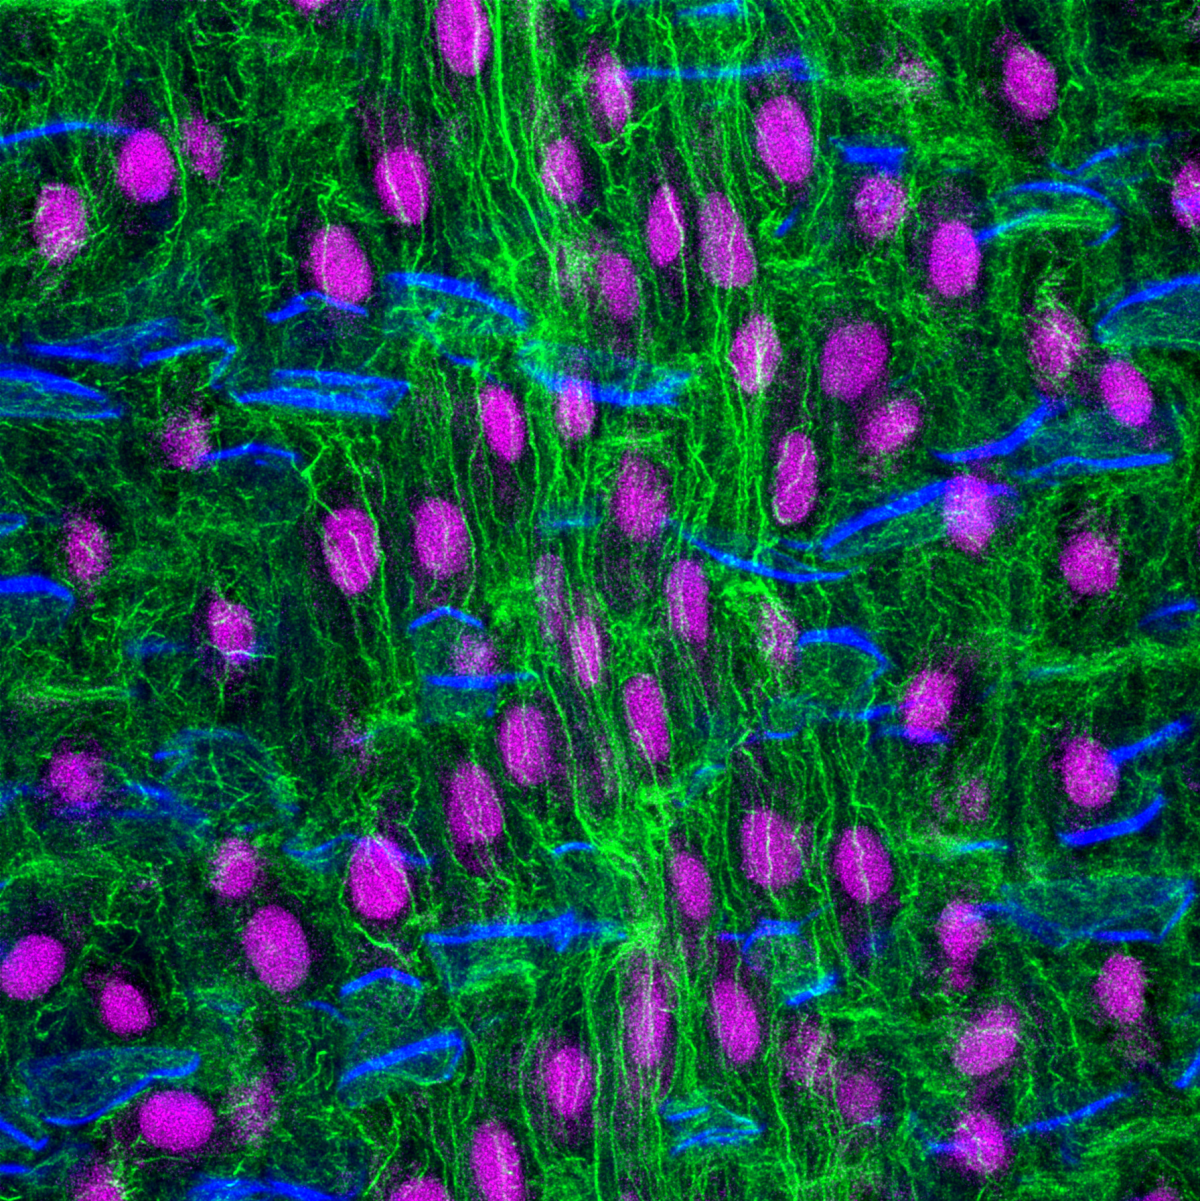
Longitudinal section of a corn root seedling. The root sample was fixed in formaldehyde, sectioned with a vibratome and stained with fluorophores that label the actin cytoskeleton (Alexa-Fluor-Phalloidin- green), nucleus (propidium iodide- magenta) and cell wall (calcofluor- blue). The root section was imaged with a Leica SP8 confocal microscope and deconvolved using Huygens software. The work is part of a project to understand how the actin cytoskeleton regulates the growth and development of plant roots.
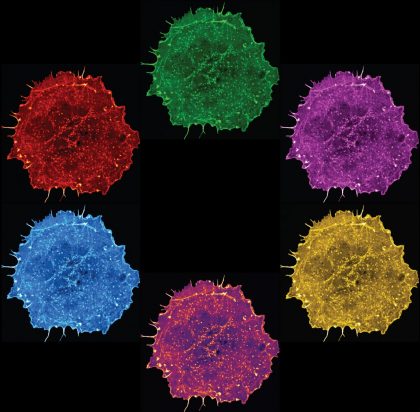
18. The Colour Wheel
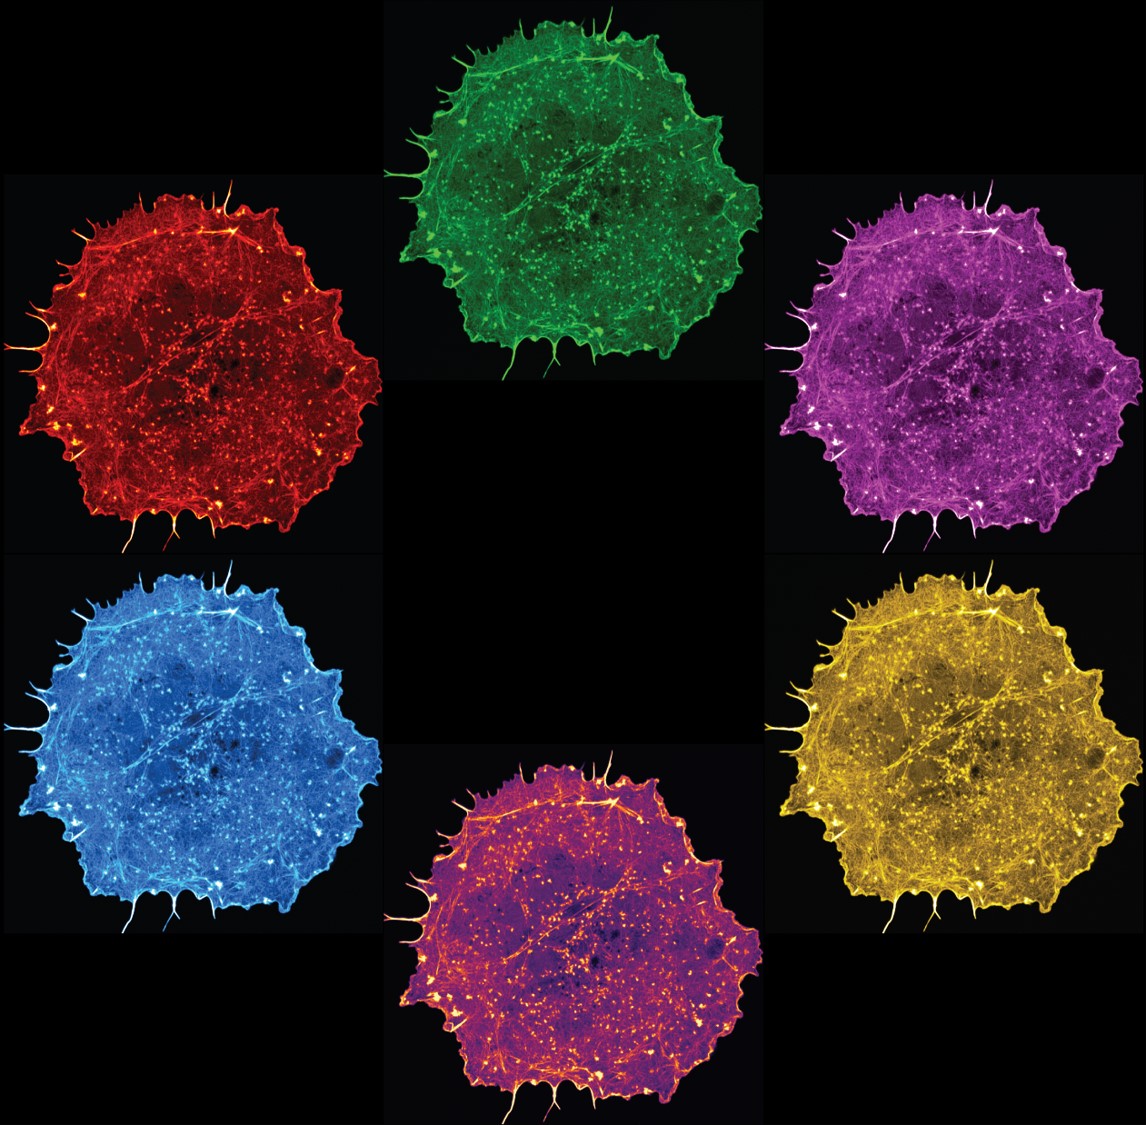
The image shows six COS-7 cells expressing LifeAct, a fluorescent reporter for actin filaments, demonstrating their intricate network of actin cytoskeleton.
Remember to vote for your favourite image here before 12:00 pm on 25th November, and join us at our virtual symposium to find out the winner!




Get in touch with the Scottish Microscopy Society!
Feel free to contact us or join our mailing list using the contact form below.

